We’re experts in crafting data-driven, powerful stories.

Image
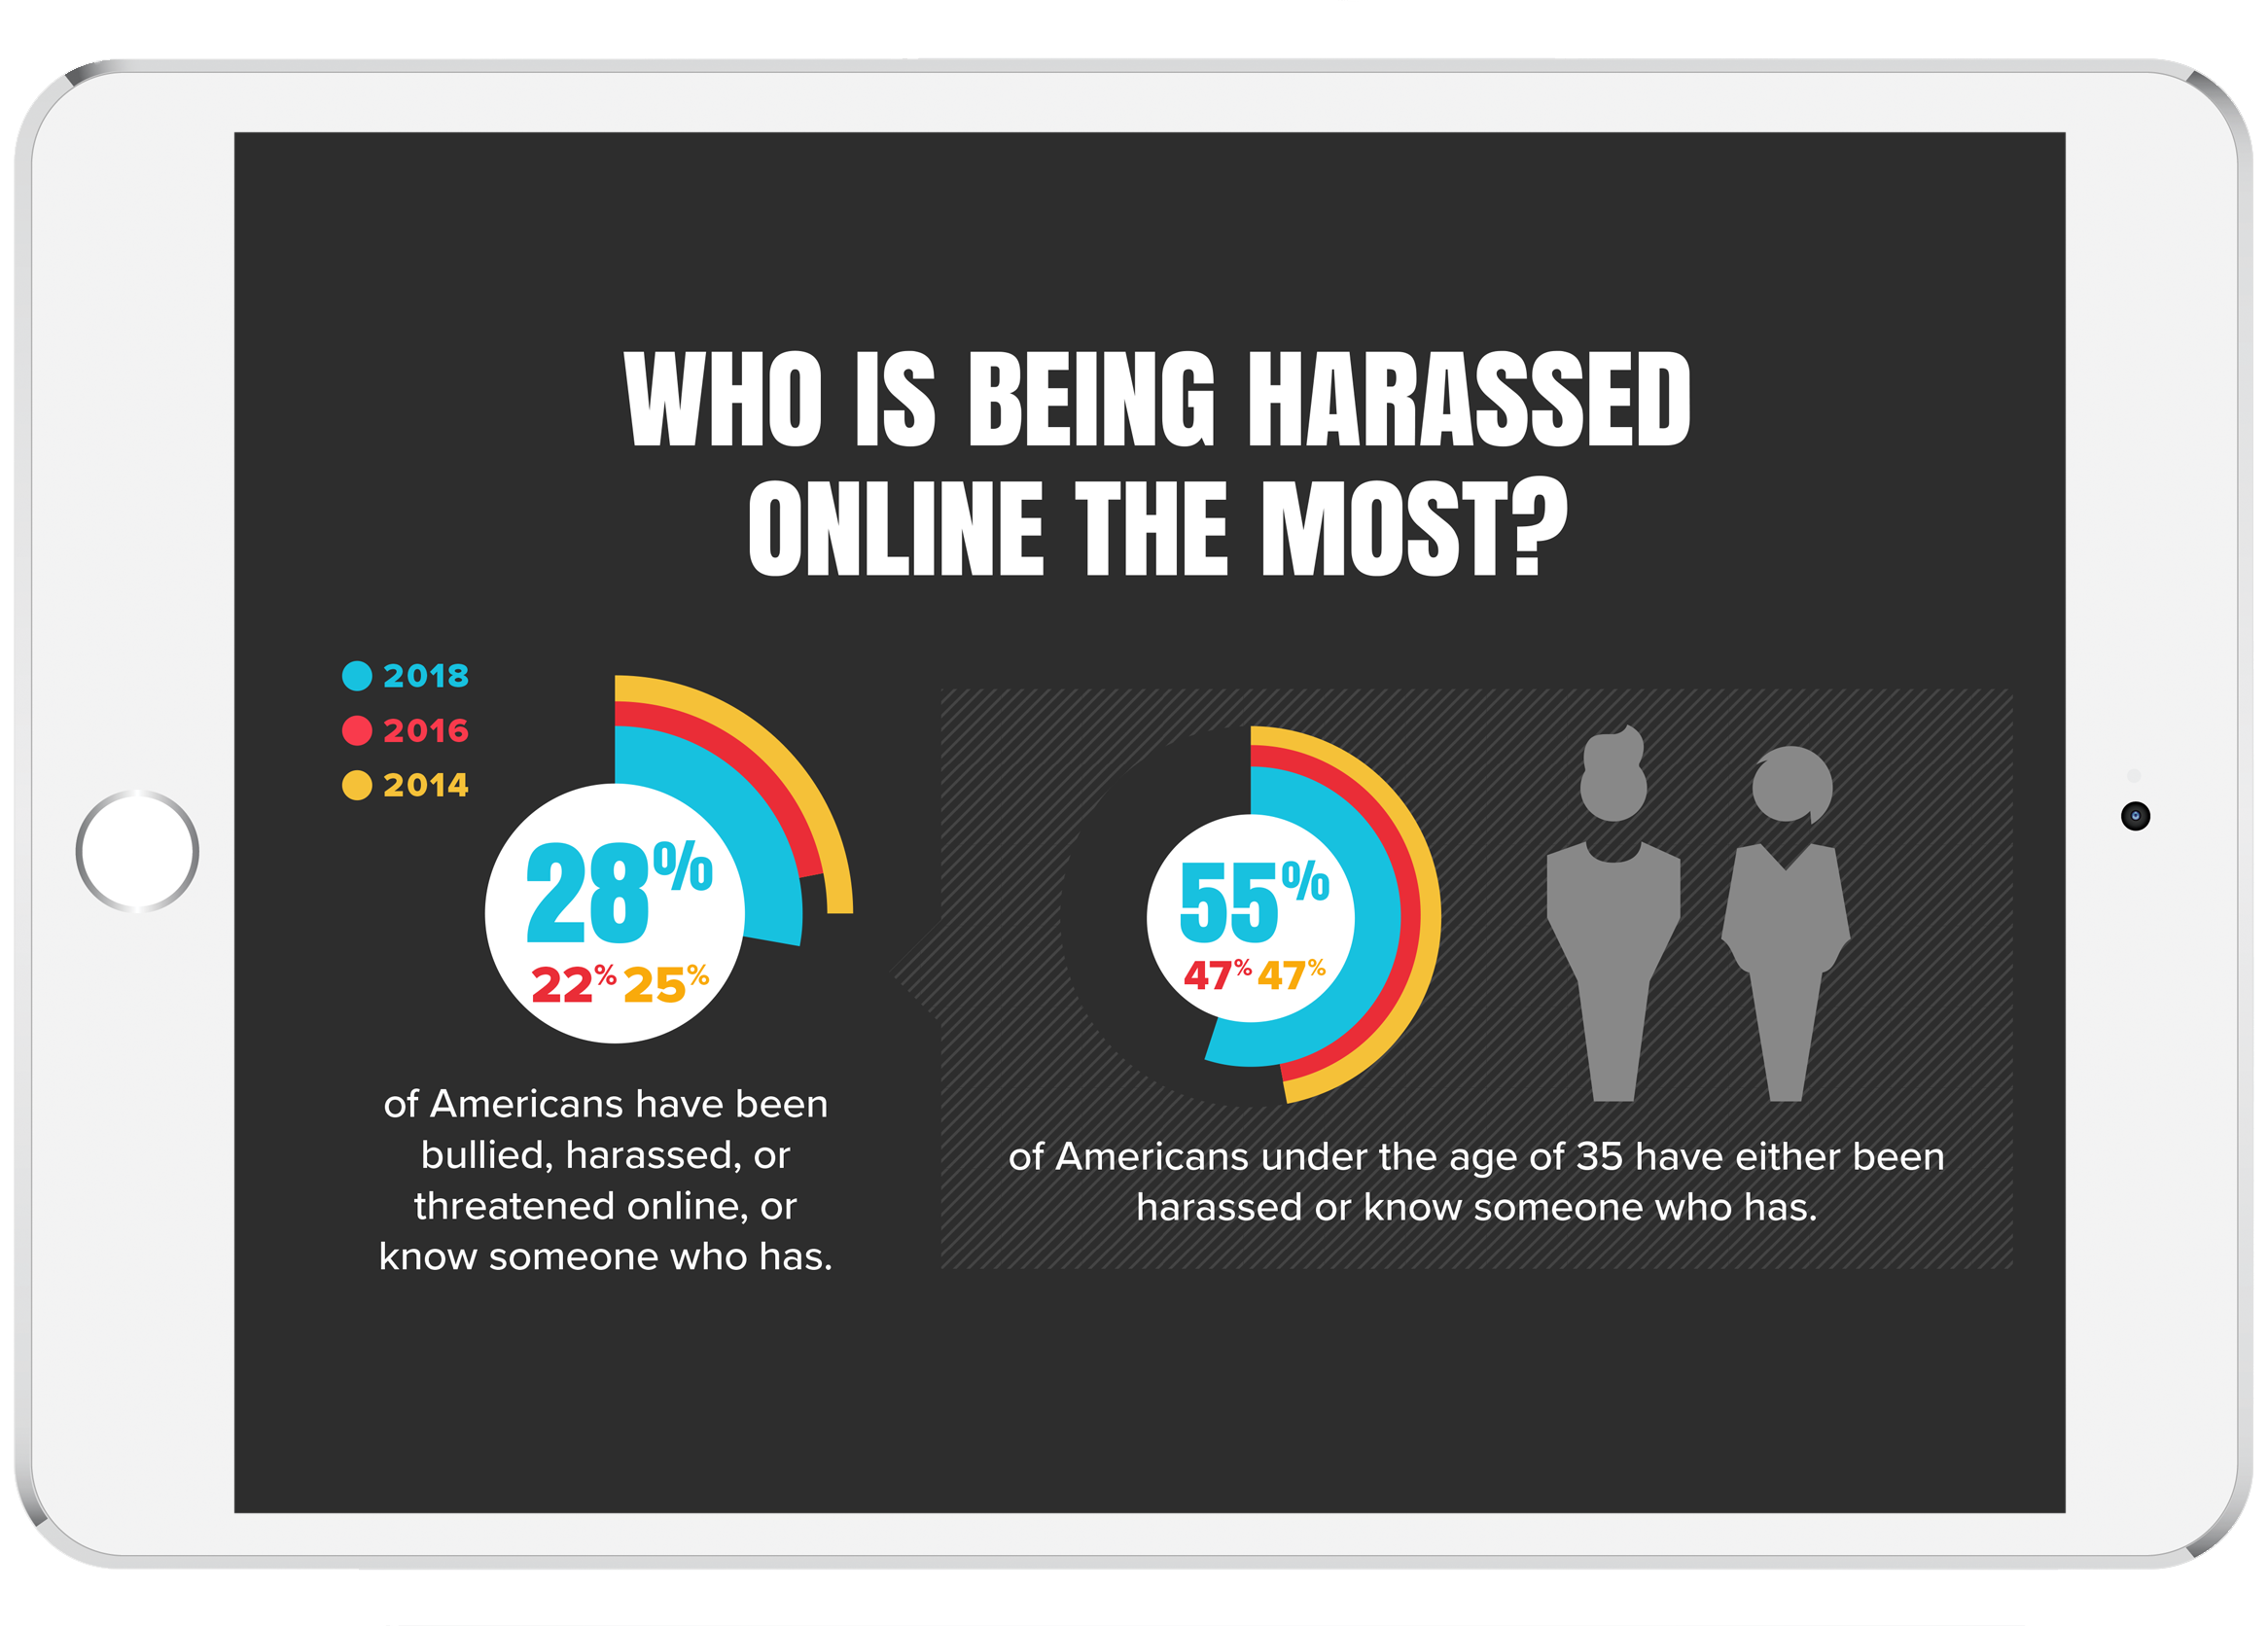
Online Harassment in 2018

"We have relevant data to share, but we don’t know how to break it down in a way that people can easily understand."

Solve your challenges telling awesome data-driven stories through our collaborative copywriting and strategic process.

  • Identify overarching message of infographic and/or data visualization.
  • Define target audiences and what will motivate them to read and share it.
  • Dataset assessment to identify your most important data points.
  • Create story arch.

"How do we transform our data to inspire people to read and share it?"

Get clarity on the story you want to tell through storyboarding, engaging infographic design, and interactive app development.

  • Wireframe key data points and visuals.
  • Design infographic to draw target audience's attention so they can digest each piece of data quickly and move to the next point.
  • Develop interactive design prototypes for data visualization applications.
  • Implement final design and app.
  • Multichannel marketing and PR to promote the infographic or data visualization.

Ready to talk about your project?

"We need help polling people on an issue that’s critical to our advocacy work and turning the data into an infographic."

Working with our researchers and pollsters, we’ll help you craft the perfect poll or survey to target audiences so you get the data you need to understand the landscape.

  • Quantitative research on advocacy issues.
  • Data analysis to make critical decisions.
  • Predictive data modeling to target specific audiences and different segments.

Brady Campaign: Gun Store Transparency

Rad Campaign teamed up with Brady Campaign to create GunStoreTransparency.org, the largest interactive visualization and publicly searchable database, that educates policymakers, the media, and researchers about which gun stores across the US violate laws.

Online Harassment Persists

This poll and infographic was developed in the year following the #MeToo movement to illustrate the current state of online harassment, and whether efforts to combat harassment are working.

Youth Voter Engagement Index

The Youth Electoral Significance Index visualizes electoral research data and ratings into a searchable tool to help campaign managers and organizations focus investment decisions when doing outreach to youth voters.